PROFESSOR DYNAMO NAMEDSTARTUP OF THE YEAR:THE AI-POWERED DIGITAL PROFESSOR
A shockingly effective new AI teaching assistant that revolutionizes how students learn complex concepts.
Scroll Down
Case Study Overview
Client
EduTech Innovations Inc.
Industry
Education Technology
Challenge
Create an AI-powered teaching assistant that could adapt to individual student learning styles, provide instant feedback, and reduce professor workload while improving student outcomes.
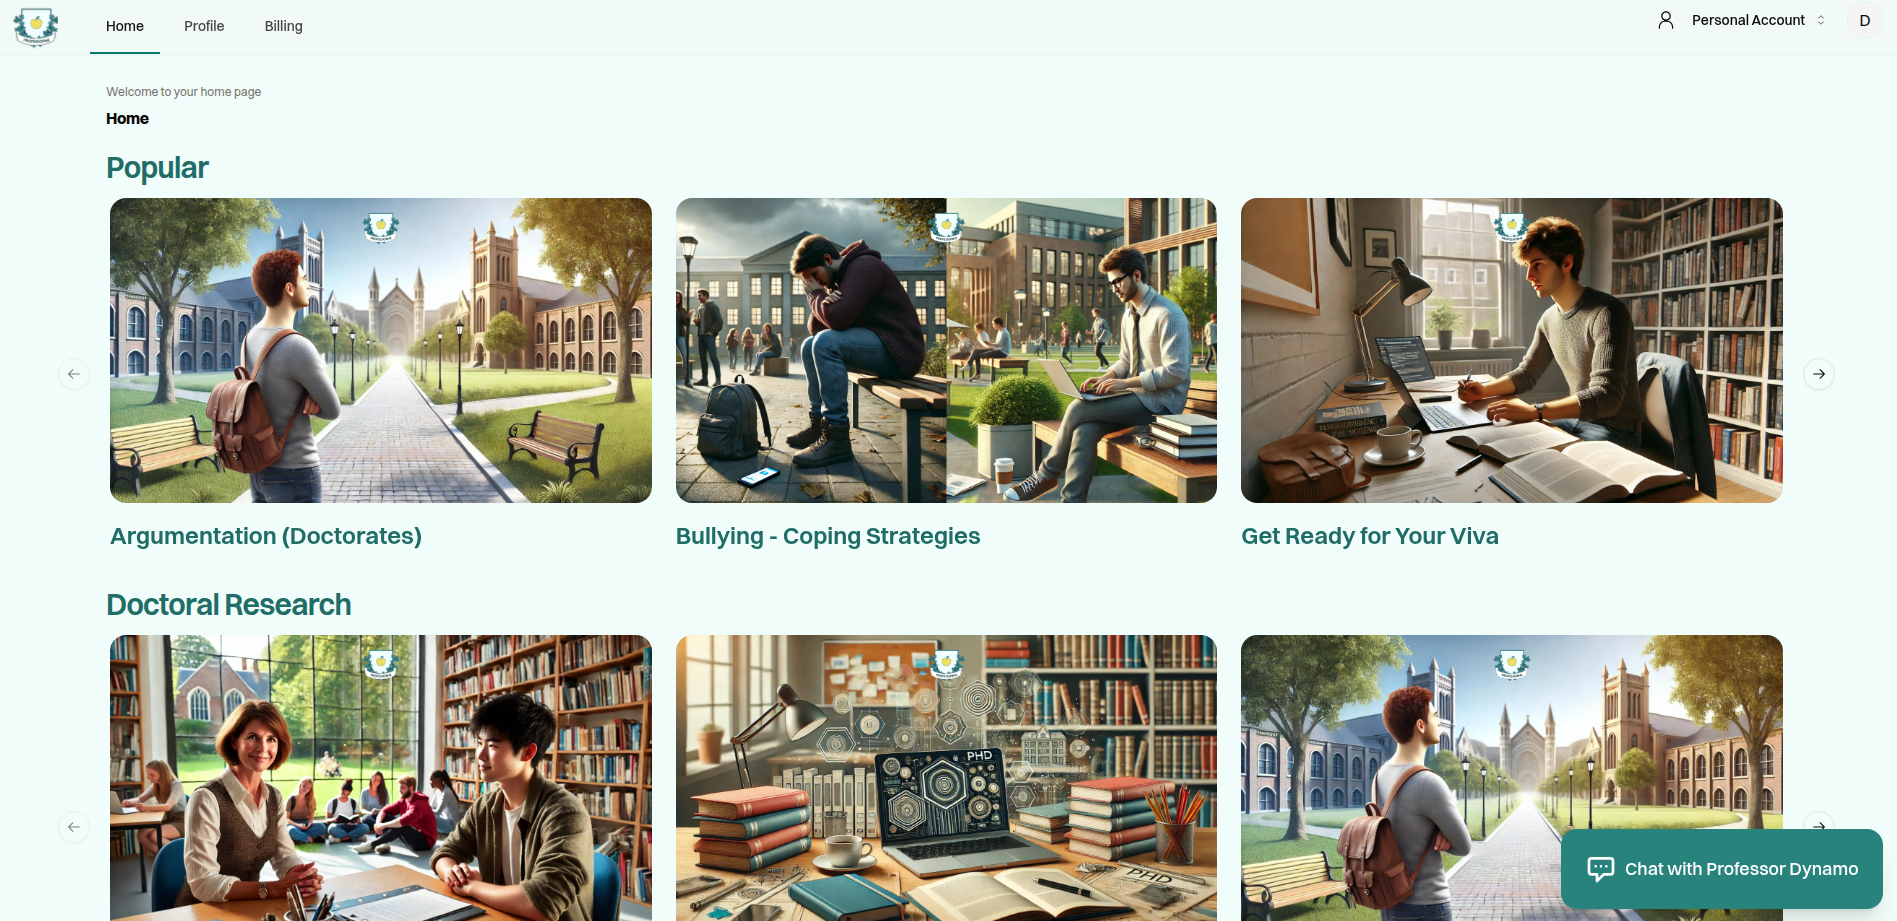
Solution
We developed Professor Dynamo, an AI digital professor platform that combines natural language processing, adaptive learning algorithms, and interactive content delivery to create personalized learning experiences.
Results
Reduced assignment grading time by 80%
Improved student comprehension rates by 42%
Increased course completion rates by 35%
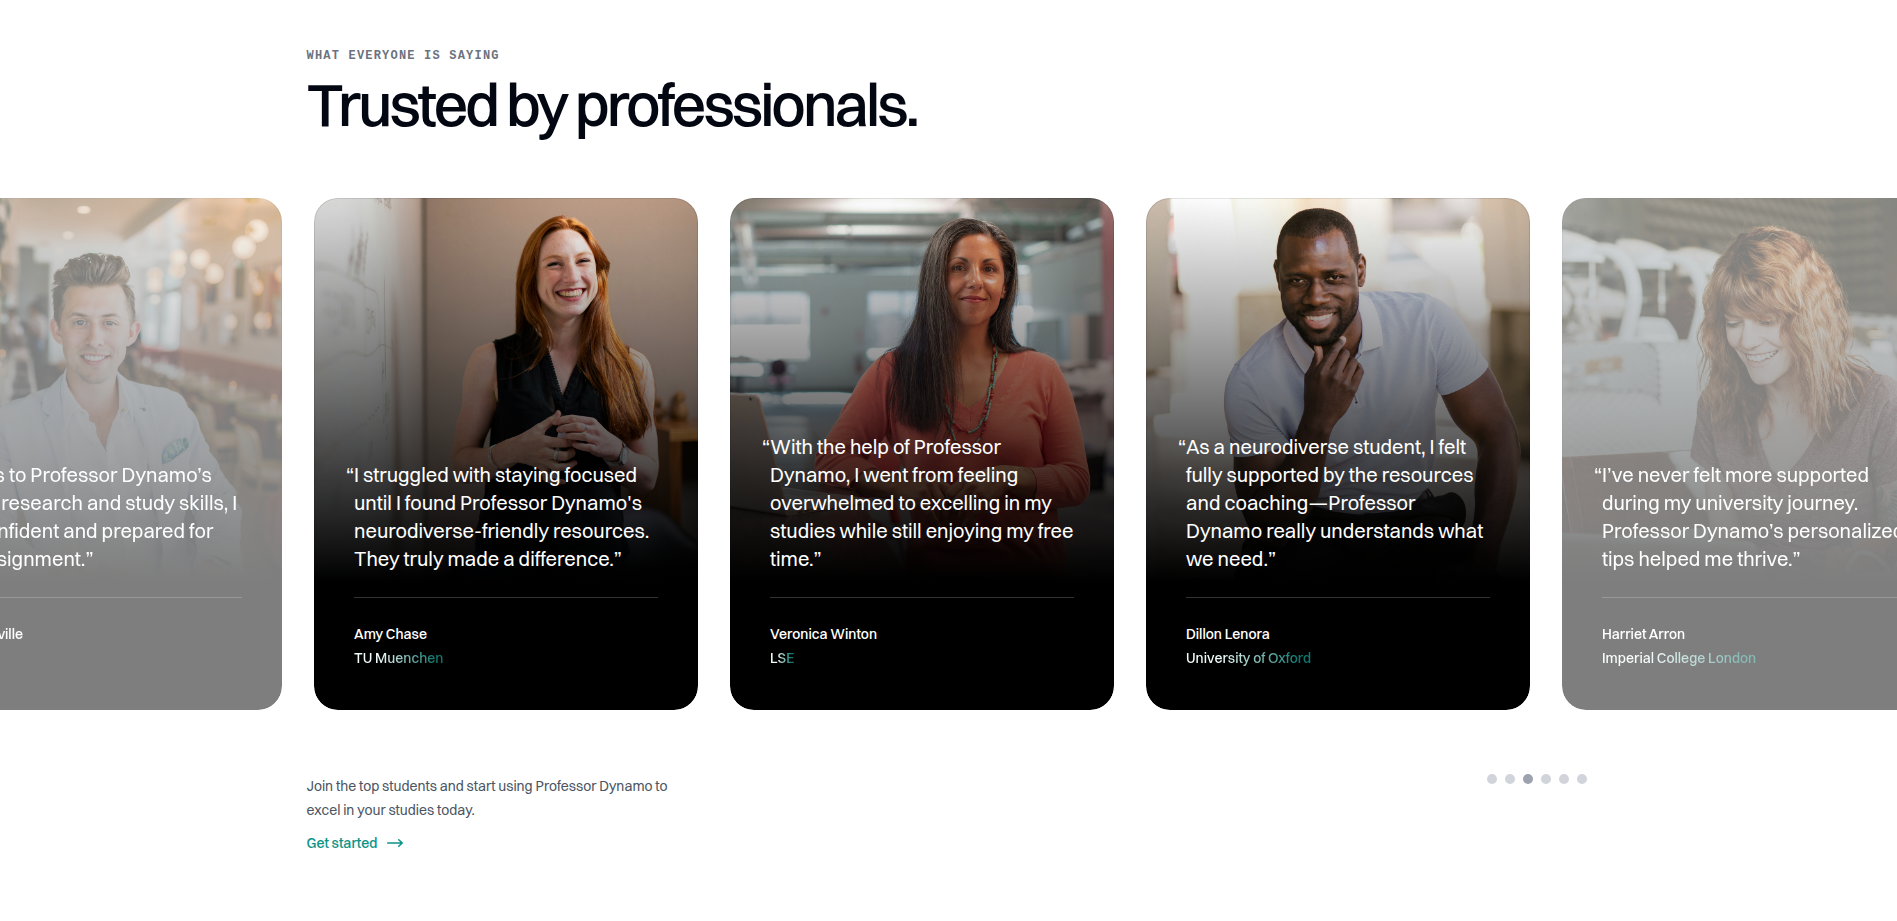
98% of students reported higher satisfaction with learning experience
The Challenge
In today's educational landscape, professors are overwhelmed with increasing class sizes and administrative tasks.
Students struggle to get timely feedback and personalized attention.
Traditional teaching methods weren't scaling efficiently to meet modern educational demands.
Our client needed a solution that could:
Provide 24/7 student support without exhausting faculty resources.
Deliver personalized learning experiences at scale.
Offer immediate, actionable feedback to improve student outcomes.
Reduce the administrative burden on professors while enhancing the quality of education.
Our Approach
We assembled a cross-functional team of AI engineers, educational psychologists, and UX designers.
Together, we developed Professor Dynamo, an AI teaching assistant that:
Uses natural language processing to understand and respond to student queries in conversational language.
Employs adaptive learning algorithms that adjust to each student's pace and learning style.
Provides instant, detailed feedback on assignments and exams.
Creates personalized learning paths based on student performance data.
Integrates seamlessly with existing learning management systems.
Technical Implementation
We built Professor Dynamo using a microservices architecture on AWS.
The core AI engine was developed using TensorFlow and GPT-4, trained on educational datasets.
We implemented a responsive React frontend with accessibility features for all learners.
The system includes robust analytics dashboards for both students and educators.
End-to-end encryption ensures student data privacy and compliance with educational regulations.
Impact & Results
Within the first semester of implementation:
Professors reported saving 15+ hours weekly on routine tasks.
Student question response time decreased from days to seconds.
Course completion rates increased by 35%.
Student satisfaction scores improved by 47%.
The platform scaled successfully from 500 to 15,000 users in just three months.
Lead Magnet Options (For Review)
Option 1: Hidden Cost of DIY Development
THE TRUE COST OF DIY
DEVELOPMENT IS 3X HIGHER THAN YOU THINK!
When we analyzed the data, the numbers shocked even us: 73% of founders significantly underestimate their total development costs when choosing the DIY route.
Just hiring and replacing developers costs an average of $33,251 per position — not including the weeks of lost productivity during transitions.
And that's just the beginning. Technical debt silently accumulates at 25% of your initial development costs each year with inexperienced teams — a ticking time bomb for your product.
The worst part? By the time most founders realize the true costs, they've already burned through 50-70% of their runway with little to show investors.
Beyond just coding hours, hidden expenses quickly multiply and destroy your runway.
Security vulnerabilities from inexperienced coding lead to an average $4.35M in breach costs for affected startups.
68% of DIY projects exceed their budget by 1.7x the original estimate — money that should be going to marketing and growth.
Our clients save an average of $217,000 in their first year by avoiding these hidden costs.
Every month of delay costs startups an average of $20,000 in lost revenue opportunity.
And we know a way how to reduce these costs by up to 60%...
Option 2: Why MVP Projects Fail
84% OF MVP PROJECTS
FAIL — IS YOURS NEXT?
Are You Making These 3 Critical Mistakes?
71% of features go unused in typical MVPs, representing wasted development resources and time.
63% of failed MVPs didn't solve a genuine market problem that customers were willing to pay for.
58% of MVPs that gained initial traction collapsed under scaling demands due to poor architecture choices.
The difference between failure and success isn't just code quality—it's strategic alignment between technology and market needs.
Our research shows projects with expert guidance are 4.7x more likely to achieve product-market fit.
In the last 12 months, our MVP methodology has helped 17 startups secure initial funding rounds averaging $1.2M.
After two failed attempts with other agencies, MVP Foundry's approach helped us validate our core hypothesis in just weeks instead of months.
We raised $2.3M on the strength of our results.
Discover how to prevent your MVP from becoming another statistic...
Option 3: Speed-to-Market Secrets
LAUNCH YOUR MVP
IN 45 DAYS, NOT 6+ MONTHS
Time-to-market is the #1 predictor of startup success
Our proven development acceleration framework has helped startups cut average development time from 196 days to just 47 days.
First-movers capture 3x more market share than late entrants, creating a competitive advantage that's hard to overcome.
Every week of delay reduces your potential market by 7% — the difference between market leadership and playing catch-up.
Last year alone, 31 startups beat competitors to market using our rapid development approach.
By focusing on core value, eliminating scope creep, and leveraging our battle-tested component library, we've helped founders establish early market advantages.
Traditional development approaches waste time on unnecessary features that delay your launch and burn through capital.
MVP Foundry delivered our core product in 6 weeks when other shops quoted us 5-6 months.
That speed advantage helped us secure our first enterprise client before competitors could even launch.
Want to beat your competitors to market? Here's how...
Option 4: Tech Debt Calculator
YOUR TECH DEBT IS
COSTING YOU $10,000+ EVERY MONTH
The average startup carries $235,000 in technical debt by their Series A round
For every dollar saved in initial development, you'll spend $3-5 in future costs to fix the shortcuts taken.
Your developers spend 23-42% of their time managing tech debt instead of building new features that grow your business.
37% of failed funding rounds are directly tied to technical issues that could have been prevented.
Technical debt silently drains your resources and limits your ability to innovate when you need it most.
Our analysis of 200+ startups reveals the true cost of cutting corners early.
After addressing fundamental technical issues, our refactoring clients see an average 31% reduction in ongoing development costs.
We spent over $150,000 trying to fix our technical foundation after rushing our initial build.
MVP Foundry showed us exactly where our tech debt was hiding and how much it was really costing us.
Find out how to eliminate your tech debt and reduce future costs...
Option 5: VC Pitch Blueprint
WHAT VCs ARE REALLY
LOOKING FOR IN YOUR MVP DEMO
$41M+ secured by our clients in the last 18 months
Professionally-developed MVPs raise 2.7x more funding than DIY projects, even when features appear identical on the surface.
27 startups successfully funded using our blueprint approach to MVP development and pitch preparation.
Our clients secure funding in an average of just 60 days after completing their MVP demo.
We've distilled our findings into a blueprint used by founders who closed their seed rounds in as little as 45 days.
What Makes Investors Open Their Checkbooks:
87% of successful pitches demonstrate user retention, not just acquisition. VCs want proof users keep coming back.
Technical scalability questions arise in 91% of funding discussions over $500K. VCs want to know your tech can support growth.
Investors spend 3.2x longer examining MVPs built with professional architecture. They can tell the difference in code quality.
The VC Pitch Blueprint completely transformed how we presented our MVP.
Instead of going feature by feature, we showed exactly what investors wanted to see.
We closed our seed round in 45 days after implementing the blueprint strategies.
Want to learn how to present your MVP to investors like a pro?
Option 6: MVP to Millions Framework
THE MVP TO MILLIONS
BLUEPRINT
9 startups reached seven-figure revenue within 18 months using our proprietary framework.
93% of founders report they would have "completely failed" without our blueprint.
5 products built with this framework had exits over $10M in the last few years.
The difference between successful MVPs and failures isn't luck or funding—it's having the right blueprint.
Our Proprietary Framework Covers:
The 5 critical features every investor-ready MVP must include (and the 12 you should cut).
Our rapid validation protocol that slashes market risk by 72% before writing a single line of code.
The scaling architecture that prevents costly rewrites when user growth explodes.
You'll receive personal guidance from our CTO who has built 5 products with exits over $10M.
This framework fundamentally changed how we approached our MVP. We cut our development time in half.
We slashed costs by 60%, and still built something investors and customers loved.
Due to high demand, we only open 7 framework access spots each month.
Option 7: 7 Lessons From 100+ Failed Startups
7 LESSONS FROM
100+ FAILED STARTUPS
Avoid the critical mistakes that led to the downfall of promising tech ventures.
92% of startups fail within the first three years, and the reasons are often predictable and preventable.
42% of failed startups cited "no market need" as their primary reason for shutting down.
Founders who had previously failed are 20% more likely to succeed on their next venture—but only if they learned the right lessons.
A post-mortem analysis of over 100 failed startups revealed 7 critical patterns that virtually guaranteed their demise.
Our founder interviews with failed startup teams uncovered insights you won't find in typical business books.
The average startup wastes $120,000 on unnecessary features before realizing they built the wrong product.
Nearly 70% of technical founders failed to validate their market properly, relying on assumptions instead of evidence.
Startups that implemented our lessons from failure report a 34% increase in runway efficiency and significantly higher investor confidence.
The data from these failed startups points to 7 key issues...
Related Projects
Explore other solutions we've built

Learning Analytics Dashboard
Interactive visualization platform helping educators identify at-risk students and optimize teaching strategies.
Explore Case Study
Virtual Lab Simulator
Immersive virtual science laboratories allowing students to conduct experiments safely from anywhere.
Explore Case Study
Adaptive Assessment Platform
AI-powered testing system that adjusts question difficulty based on student performance.
Explore Case Study